Document: Tropical Purse Seine Fisheries Bycatch: Eastern Pacific Ocean
SHARE:
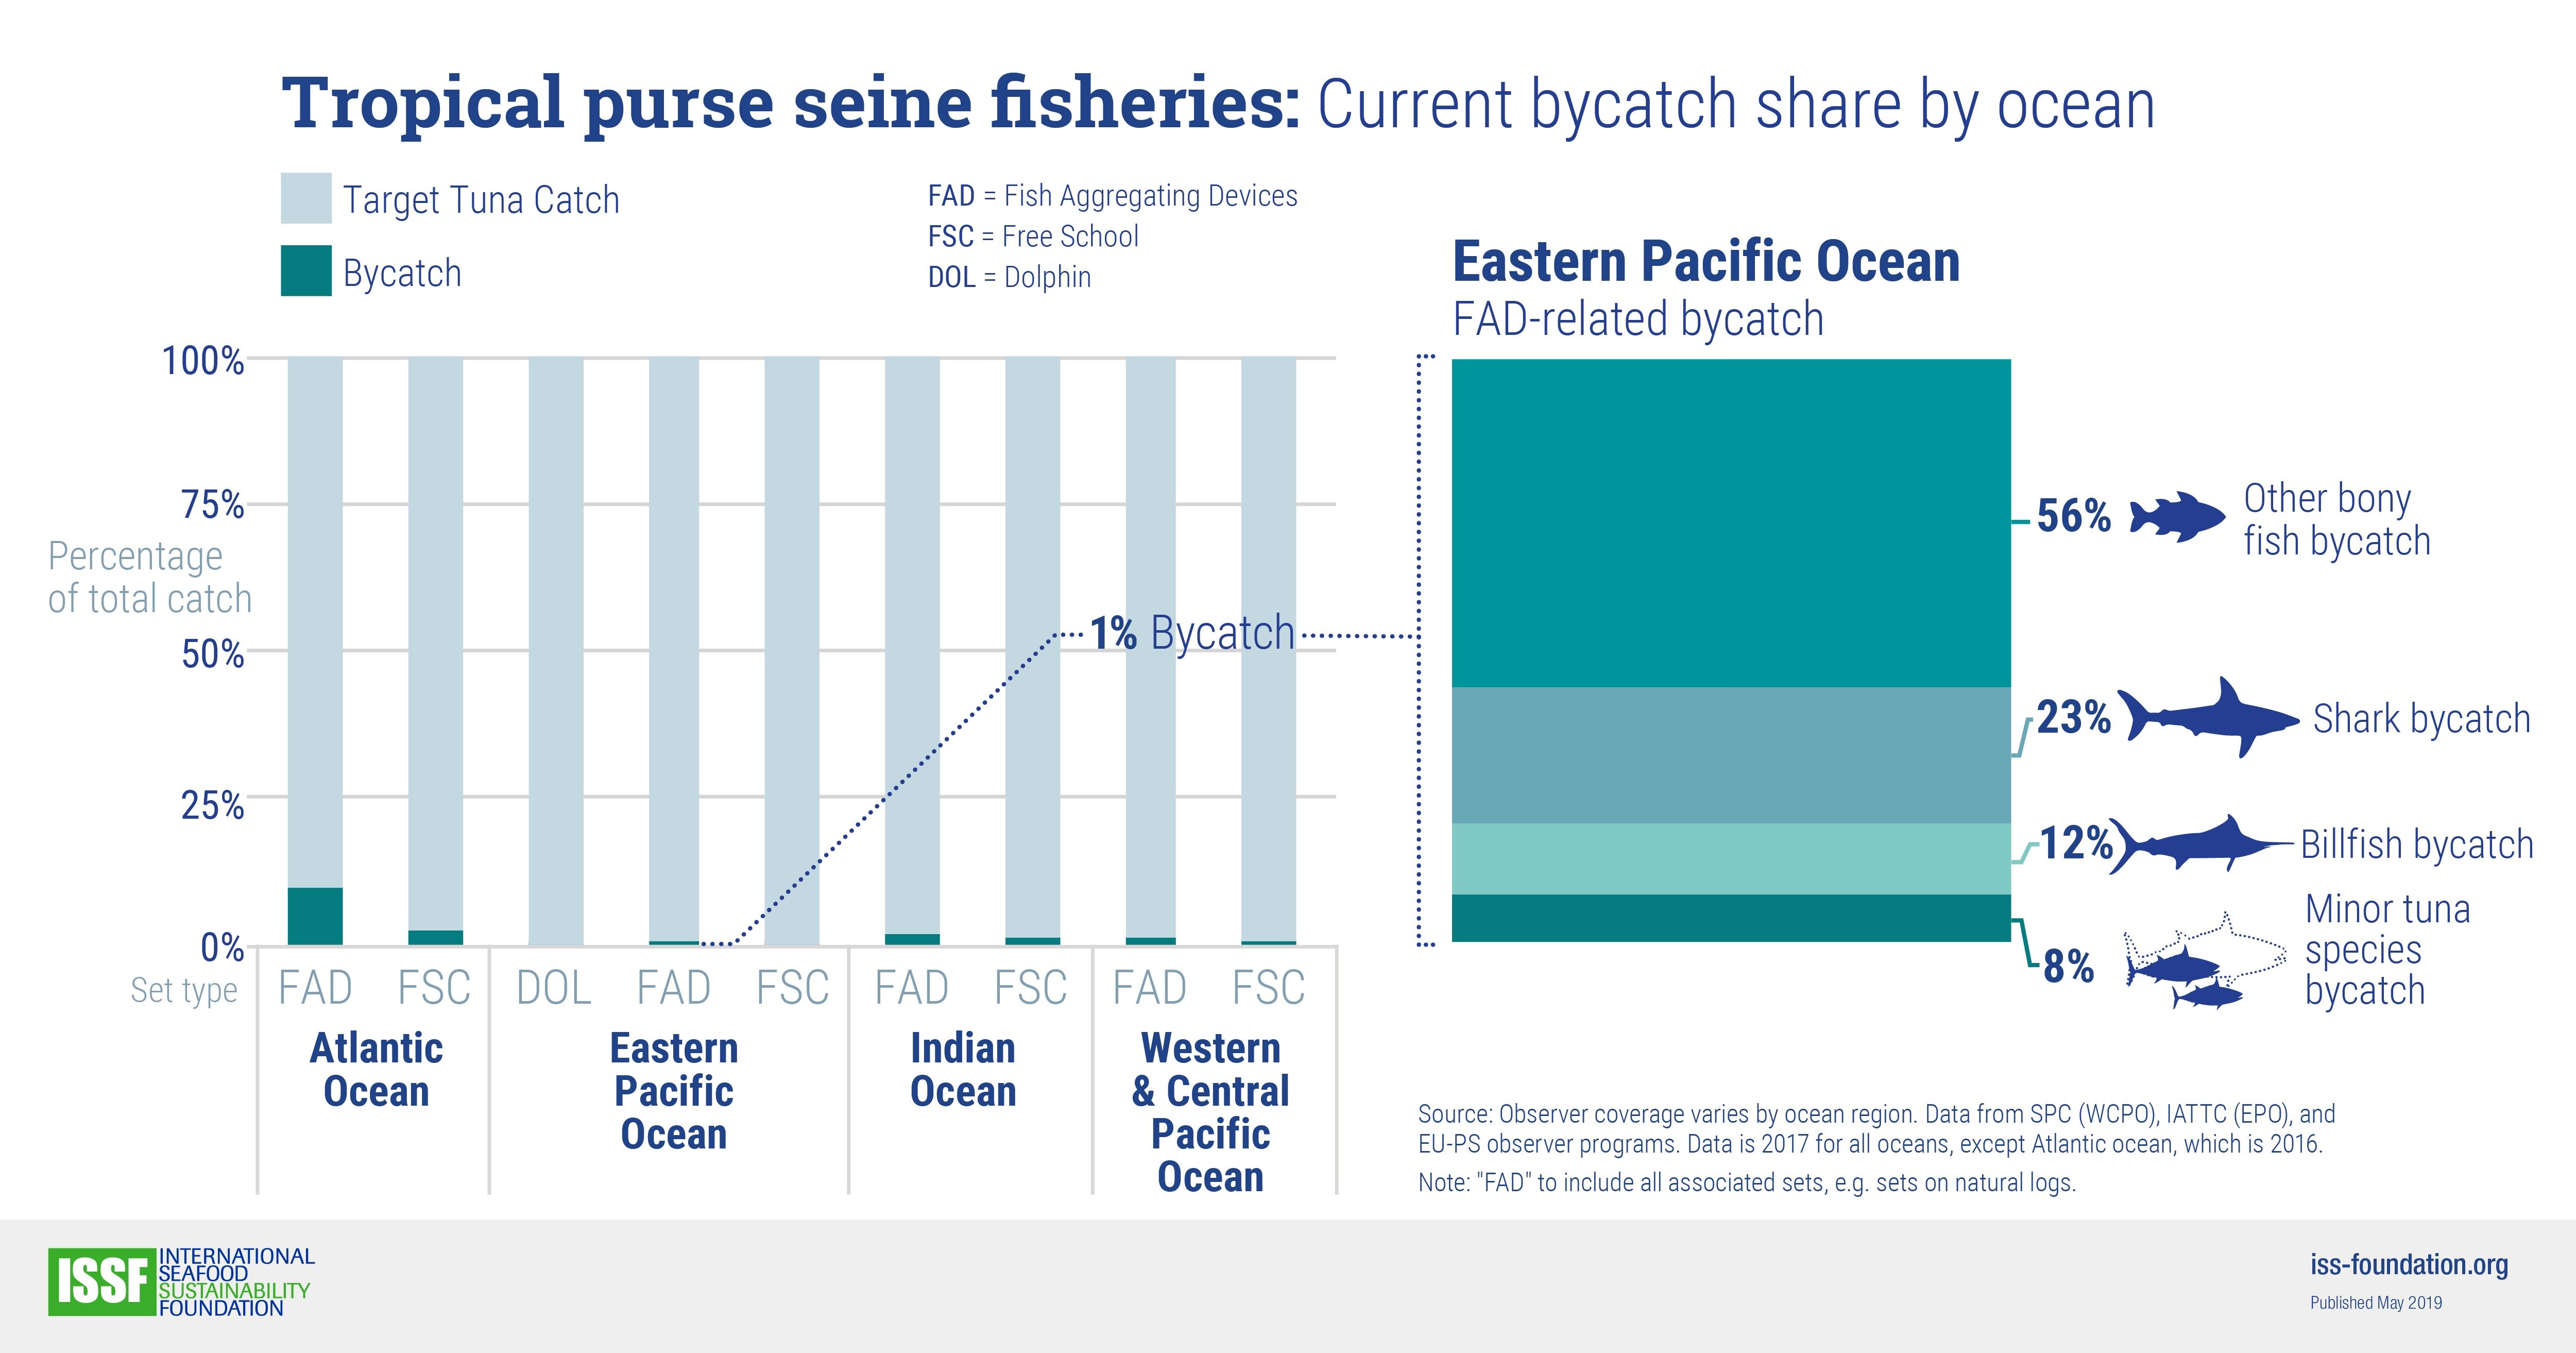
This infographic is part a four-part series, “Tropical Purse Seine Fisheries: Current Bycatch Share by Ocean.”
Each graphic highlights a particular region — the Eastern Pacific Ocean, in this one.
First, on the left, the graphic shows the percentage of the catch that is either target tuna or bycatch — in each ocean region, and based on set type (fish aggregating device or FAD, free school, and dolphin).
Then, on the right, the graphic takes a closer look at FAD-related bycatch in the highlighted ocean region, with percentages for each marine species.
The data are from 2017, except for the Atlantic Ocean data, which are from 2016.
Downloads: 18360 | 260446
